We will learn how to use the Chrome DevTools to debug webpages and, by doing so, gain a better understanding of how the Web (and computers) work, as well as gain experience in using an invaluable tool for web-scraping and other programming.
Lessons so far:
- Elements of a Webpage
- The Styles of a Webpage
- Watching Traffic with the Network Panel
- Reading the Metadata of Data Files in the Network Panel
Other references:
- A Web Inspector Tutorial for Front-End Developers
- Google Chrome keyboard shortcuts
- Chrome DevTools Overview
- Editing Styles And The DOM Introduction
- Network panel overview from the Chrome DevTools docs
- Safari's Developer Tools
- The F12 Developer Tools
TK: More text about what's going on in these instructions:
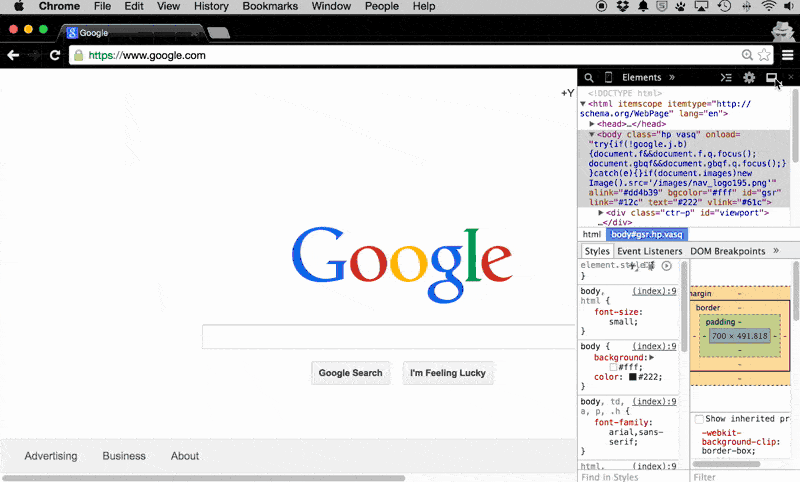
Opening the DevTools Panel
You can open the DevTools by going to the menu and selecting View -> Developer -> Developer Tools.
Or better yet, use the keyboard shortcut:
PC: Ctrl+Shift+I / Mac: Cmd+Opt+I
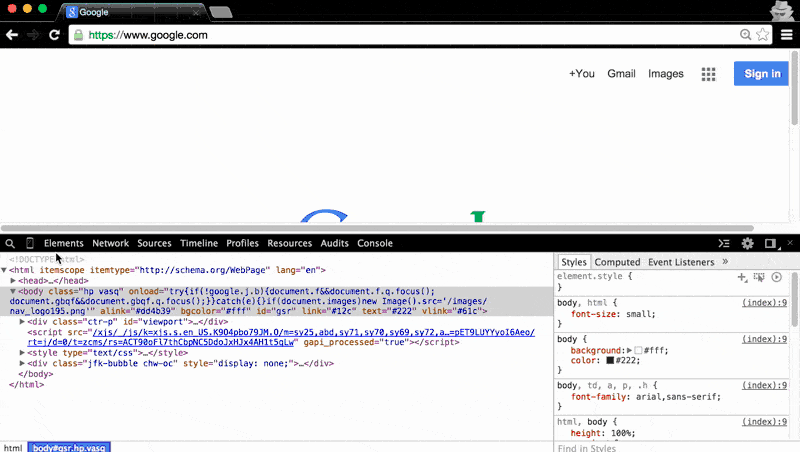
Go horizontal
Usually by default, the panel will open up vertically. This isn't an ideal layout for most web debugging tasks, so click-and-hold the layout icon (in the top right of the DevTools Panel's menubar) to see the horizontal-layout option.
Pop-out
There's also a pop-out option, which is what I normally use. For the purposes of the animated-GIF-screencasts in these tutorials, I stick to the horizontal layout.
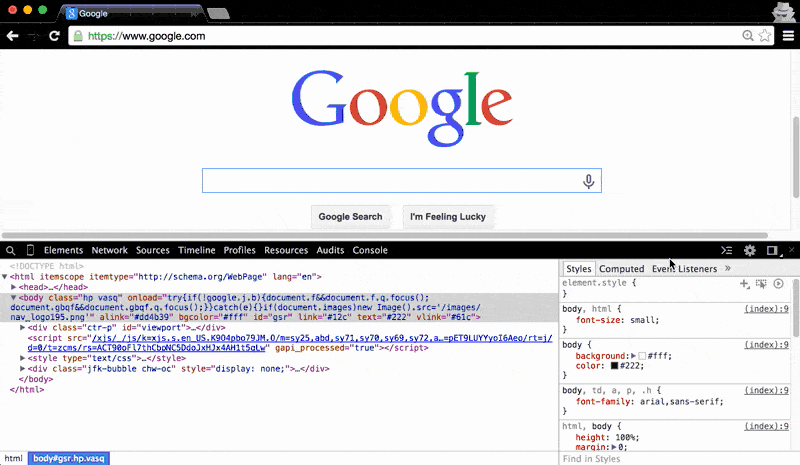
The menubar
The menubar contains three menu items that we care about:
- Elements
- Network
- Console
Disabling the cache
By default, your web browser saves copies of webpages and their files to a cache on your hard drive, so that when you visit next time, the browser reads from the cache, which is much faster than re-fetching the files across the Internet.
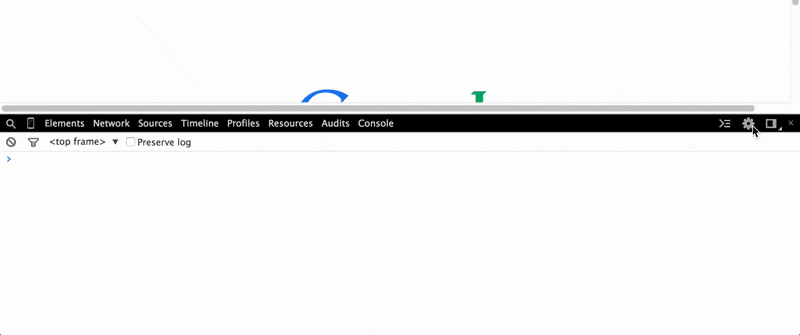
However, we don't want that convenience, at least for the purposes of debugging the browser operations. So click the little Gear icon on the DevTools menubar and select the Disable cache option.