Matplotlib is a powerful but incredibly-hard-to-use (at first) visualization library for Python.
Check out these simple examples. Then move on to the readings at the bottom of the lesson.
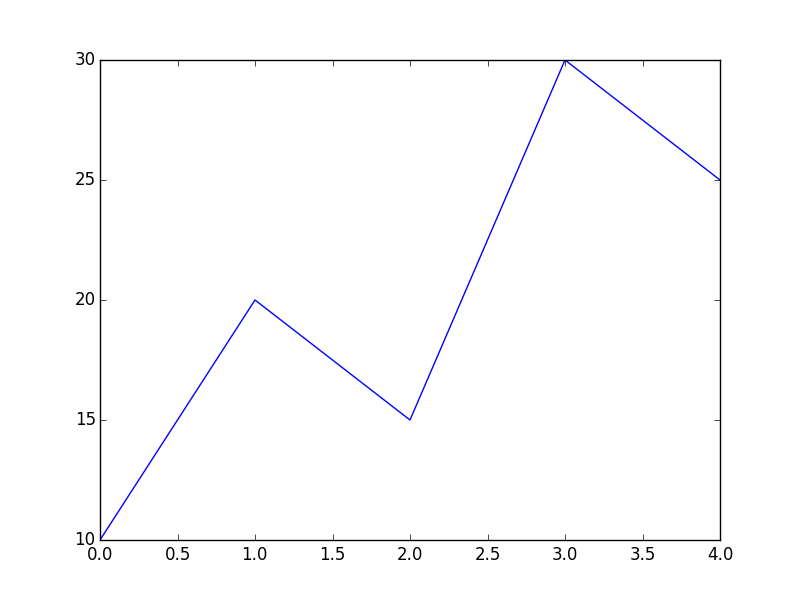
import matplotlib.pyplot as plt
data = [10, 20, 15, 30, 25]
plt.plot(data)
plt.savefig('pngs/001-simple.png')
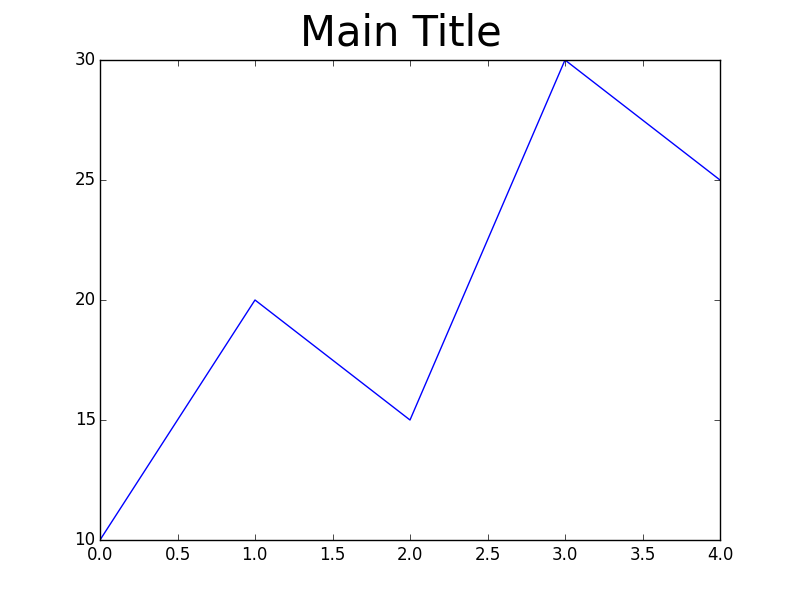
import matplotlib.pyplot as plt
data = [10, 20, 15, 30, 25]
plt.suptitle('Main Title', fontsize = 30)
plt.plot(data)
plt.savefig('pngs/002-main_title.png')
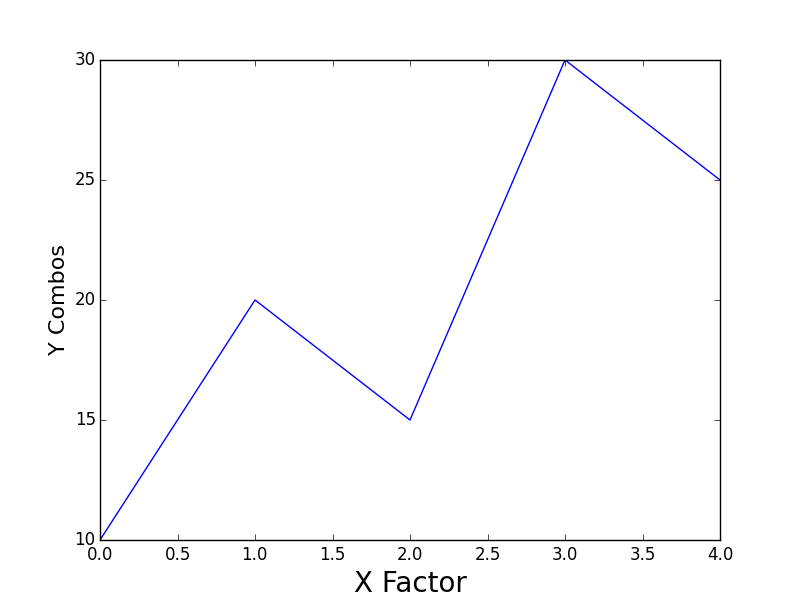
import matplotlib.pyplot as plt
data = [10, 20, 15, 30, 25]
plt.xlabel('X Factor', fontsize = 20)
plt.ylabel('Y Combos', fontsize = 16)
plt.plot(data)
plt.savefig('pngs/003-axis_labels.png')
import matplotlib.pyplot as plt
data = [10, 20, 15, 30, 25]
plt.xticks(rotation = 'vertical')
plt.yticks(rotation = 45)
plt.plot(data)
plt.savefig('pngs/004-format_ticks.png')

import matplotlib.pyplot as plt
data = [10, 20, 15, 30, 25]
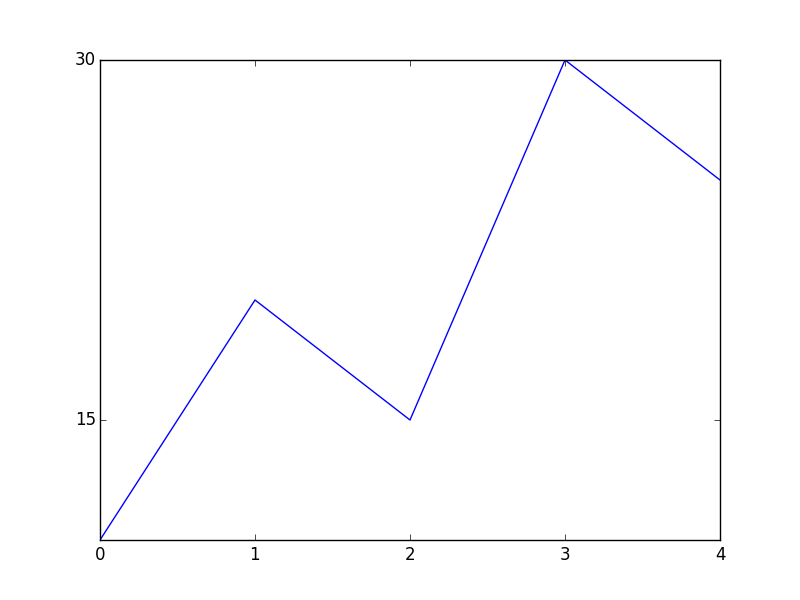
plt.yticks([15, 30])
plt.xticks([0, 1, 2, 3, 4])
plt.plot(data)
plt.savefig('pngs/005-set_ticks.png')
import matplotlib.pyplot as plt
data = [10, 20, 15, 30, 25]
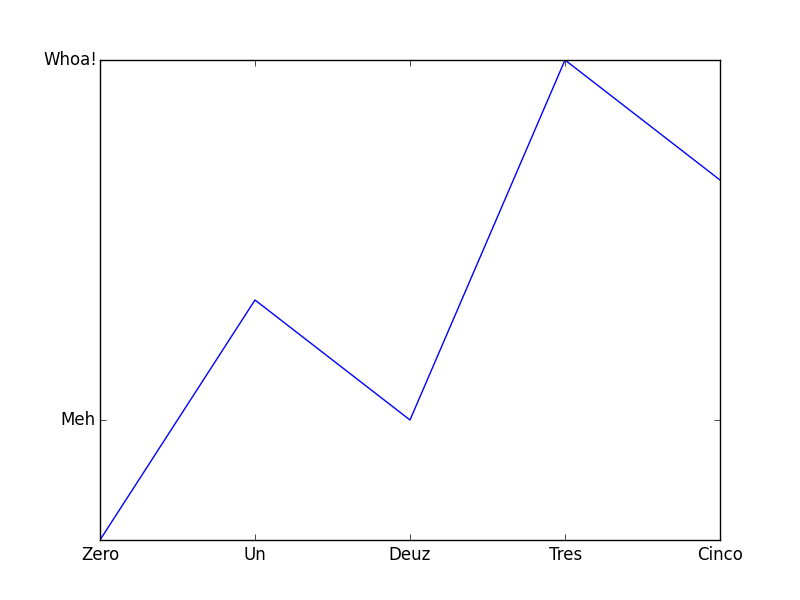
plt.yticks([15, 30], ['Meh', 'Whoa!'])
plt.xticks([0, 1, 2, 3, 4], ['Zero', 'Un', 'Deuz', 'Tres', 'Cinco'])
plt.plot(data)
plt.savefig('pngs/006-rename_ticks.png')
import matplotlib.pyplot as plt
data = [10, 20, 15, 30, 25]
# plot() the data first, so
# that xlim, ylim are autoscaled
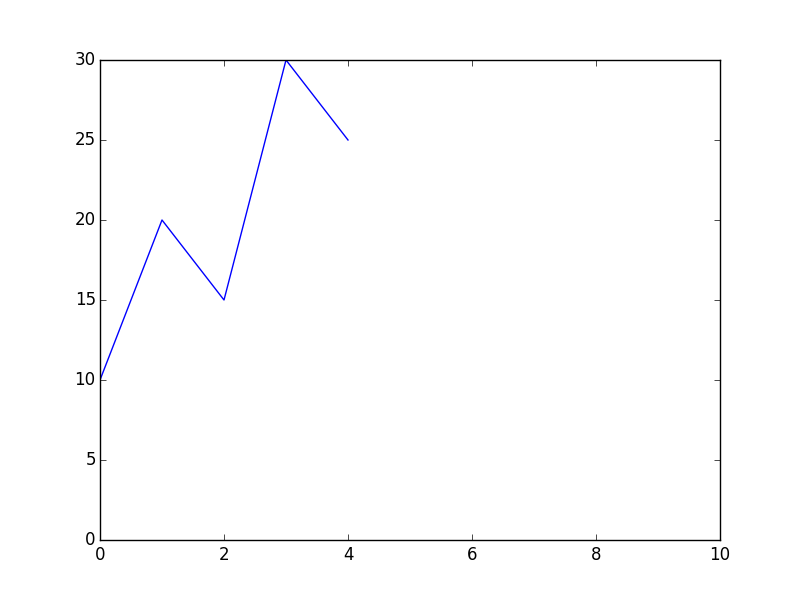
plt.plot(data)
# then adjust xlim, ylim
plt.xlim([0, 10])
plt.ylim(ymin = 0) #leave ymax unchanged
plt.savefig('pngs/007-limit_axis.png')
import matplotlib.pyplot as plt
data = [10, 20, 15, 30, 25]
plt.grid(True)
plt.plot(data)
plt.savefig('pngs/008-activate_grid.png')

import matplotlib.pyplot as plt
from matplotlib.ticker import MultipleLocator, FormatStrFormatter
from matplotlib.colors import colorConverter
data = [10, 20, 15, 30, 25]
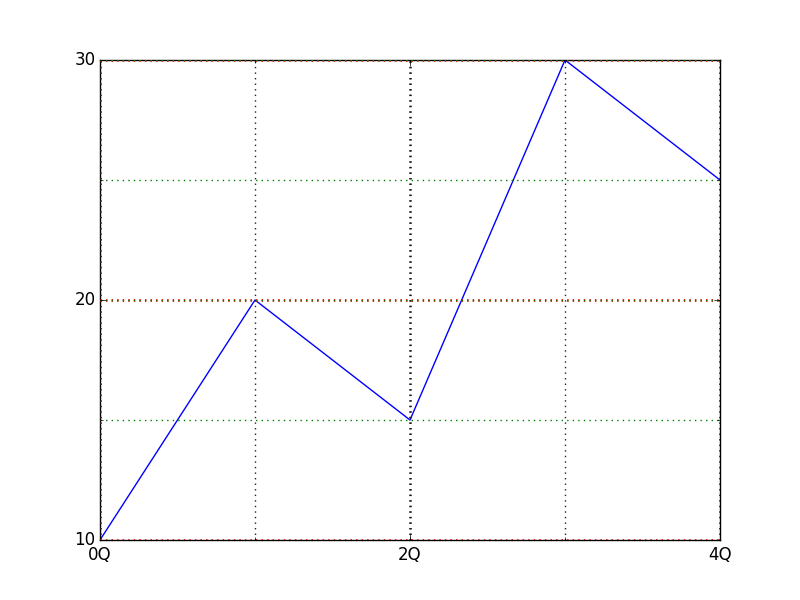
# set up the xaxis
xaxis = plt.axes().xaxis
xaxis.set_major_locator(MultipleLocator(2))
xaxis.set_minor_locator(MultipleLocator(1))
xaxis.set_major_formatter(FormatStrFormatter('%dQ'))
xaxis.grid(True, which = 'major', linewidth = 2, color = colorConverter.to_rgb('#662020'))
xaxis.grid(True, which = 'minor', linewidth = 1, color = colorConverter.to_rgb('#202020'))
# set up the yaxis
yaxis = plt.axes().yaxis
yaxis.set_major_locator(MultipleLocator(10))
yaxis.set_minor_locator(MultipleLocator(5))
yaxis.grid(True, which = 'major', linewidth = 2, color='r')
yaxis.grid(True, which = 'minor', linewidth = 1, color='g')
plt.plot(data)
plt.savefig('pngs/009-customize_grid.png')
import matplotlib.pyplot as plt
data = [10, 20, 15, 30, 25]
plt.axes().spines['right'].set_visible(False)
plt.axes().spines['top'].set_visible(False)
plt.axes().xaxis.set_ticks_position('bottom')
plt.axes().yaxis.set_ticks_position('left')
plt.plot(data)
plt.savefig('pngs/010-remove_splies.png')
#http://stackoverflow.com/questions/9750699/how-to-display-only-a-left-and-bottom-box-border-in-matplotlib

import matplotlib.pyplot as plt
data = [10, 20, 15, 30, 25]
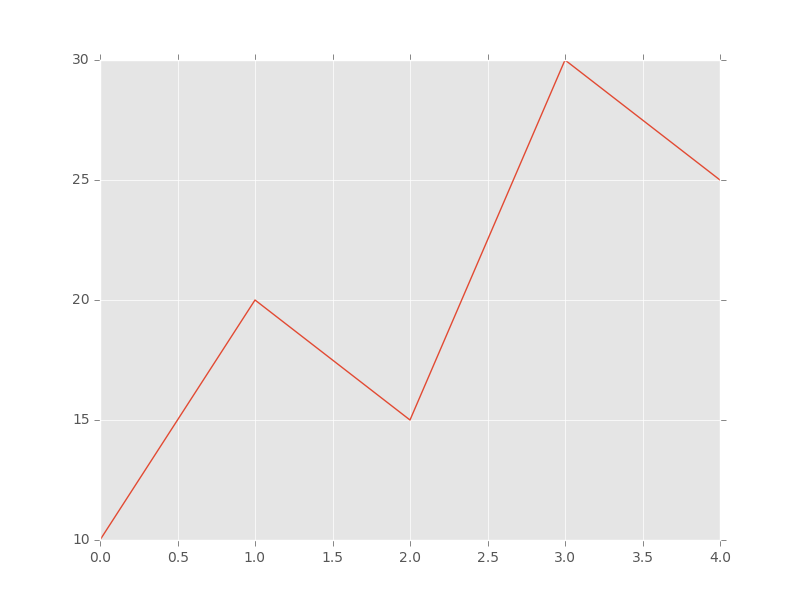
plt.style.use('ggplot')
plt.plot(data)
plt.savefig('pngs/030-use_style.png')