- Reference
- Directions
- Exercises
- 1. * Find the total number of job listings in New York
- 2. Find the total number of job listings in Alaska and Hawaii.
- 3. Using a for-loop, find the total number of job listings in China, South Africa, and Tajikistan.
- 4. Get and store job listing counts in a dictionary
- 5. * Get and store job listing counts as a list
- 6. Create an interactive Google Bar Chart showing the job counts
- 7. * Create an interactive Google Pie Chart for the 4 states
- 8. Create an interactive Google Geochart for all 4 states
- 9. Create an interactive Google Geochart for all 50 states
- All Solutions
Reference
- Touring the USAJobs.gov Site and API – Before programmatically exploring the USAJobs.gov website and API, explore it the old-fashioned way
- Introduction to Objects and Functions and a Few Keywords – Python is made up of barely more than 30 keywords. The rest are shortcut-words to let us use other programmers' useful code.
- An introduction to data serialization and Python Requests – This is less a guide to Requests and more an attempt to explain fundamental data concepts of data structures and turning them to text.
- For loops via wiki.python.org
Directions
The exercises with asterisks already have the solution. A problem with a solution usually contains hints for subsequent problems, or sometimes for the problem directly preceding it.
All the problems come with expected results, but your results may be slightly different, because the job listings change on an hourly/daily basis.
For the problems that are already done, you must still turn them in. The expectation is that you at least type them out, line by line, into iPython so each step and its effect are made clear to you.
Deliverables
Due date: Monday, May 4
Create a folder in your compjour-hw repo named: usajobs-midterm-1.
For each exercise, create a separate file, e.g.
|-- compjour-hw/
    |-- usajobs-midterm-1/
       |-- 1-1.py
       |-- 1-2.py
       |-- 1-3.py
       (etc)
Some exercises may require you to produce a file. For example, exercise 1-6 requires that you create a webpage. Store that webpage in the same directory as the script files, e.g.
|-- compjour-hw/
    |-- usajobs-midterm-1/
       |-- 1-6.py
       |-- 1-6.html
       (etc)
Exercises
1. * Find the total number of job listings in New York
Query the data.usajobs.gov API for job listings for the state of New York and print the total number of job listings in this format:
New York has XYZ job listings.
Takeaway
This is just a warmup exercise that requires little more than knowing the basics of executing Python code and how to use an external library like Requests. Pretty much every exercise from here on out will require this pattern of:
- Decide what kind of query you want to make to data.usajobs.gov
- Use
requests.get() - Parse the response as JSON and do something with it.
In the posted solution, observe how variables are used from a stylistic point. I set up my requests.get() call with:
state_name = 'New York'
atts = {"CountrySubdivision": state_name, 'NumberOfJobs': 1}
resp = requests.get(BASE_USAJOBS_URL, params = atts)
But I could've done it in one line:
resp = requests.get(BASE_USAJOBS_URL, params = {"CountrySubdivision": 'New York', 'NumberOfJobs': 1})
However, that one line is now hard to read because of its width. And while state_name = 'New York' may seem overly verbose, look at how state_name is re-used in the final print() statement, which saves me from having to type out "New York" twice.
Result
New York has 384 job listings.
Solution
import requests
BASE_USAJOBS_URL = "https://data.usajobs.gov/api/jobs"
state_name = 'New York'
atts = {"CountrySubdivision": state_name, 'NumberOfJobs': 1}
resp = requests.get(BASE_USAJOBS_URL, params = atts)
data = resp.json()
print("%s has %s job listings." % (state_name, data['TotalJobs']))
2. Find the total number of job listings in Alaska and Hawaii.
Same as problem 1-1, except print one line for each state. And print a third line that contains the sum of the two state's total job counts:
Alaska has XXX job listings.
Hawaii has YYY job listings.
Together, they have ZZZ total job listings.
Takeaway
You can almost get by with copying the solution for Exercise 1-1 and pasting it in twice, and then changing the variables for Alaska and Hawaii, respectively. And that's fine (for now). But notice how if you didn't follow my posted solution and take the time to do:
state_name = 'New York'
And instead, did:
resp = requests.get(BASE_USAJOBS_URL, params = {"CountrySubdivision": 'New York', 'NumberOfJobs': 1})
Then for this exercise, you would have to make 4 manual changes (2 for each state) in both the requests.get() call and the corresponding print() statement. Imagine how much of a pain that becomes when you have to repeat a snippet of code 10 or 10,000 times, and you should get a better sense of why variables are useful.
Quick note: To total the two job counts up, examine in specific detail how the job counts are represented in the API text response; just because they look like numbers doesn't mean that Python, when parsing the JSON, will treat them like numbers.
Result
Alaska has 207 job listings.
Hawaii has 204 job listings.
Together, they have 411 total job listings.
3. Using a for-loop, find the total number of job listings in China, South Africa, and Tajikistan.
The output should be in the same format as Exercise 1-2, but you must use a for-loop.
Takeaway
Pretty much the same code as exercises 1-1 and 1-2, except with a for-loop. Your code should end up being slightly shorter (in terms of line count) compared to 1-2, and it should just feel a little more elegant than copy-pasting the same snippet 3 times over.
Result
China currently has 13 job listings.
South Africa currently has 4 job listings.
Tajikistan currently has 7 job listings.
Together, they have 24 total job listings.
4. Get and store job listing counts in a dictionary
For each of the U.S. states of California, Florida, New York, and Maryland, get the total job listing count and store the result in a dictionary, using the name of the state as the key and the total job count – as an integer – for the corresponding value:
{'StateName1': 100, 'StateName2': 42}
Takeaway
It is rarely useful to create a program or function that just spits out made-for-human-reports text like "Alabama has 12 total jobs." More realistically, you create programs that will output or return a data structure (as in this case, a dictionary), so that other programs can easily use the result.
Result
{'California': 755, 'New York': 356, 'Maryland': 380, 'Florida': 361}
5. * Get and store job listing counts as a list
For the same states as Exercise 1-4, get their total job listing counts, but store the result in a list. More specifically, a list in which each member is itself a list, e.g.
[['StateName1', 100], ['StateName2', 42]]
Takeaway
Same concept as Exercise 1-5. It's worth noting how the exact same data can be sufficiently represented either as a dictionary or a list. However, think about the difference in how an end user accesses the data members. For example, compare how you would get Maryland's number of jobs if the result (as in 1-5) is a dictionary:
result['Maryland']
– to how you would access that same data point from a list:
result[2][0]
(hint: one data structure is more human-friendly than the other, in this situation)
Result
[['California', 755], ['Florida', 361], ['Maryland', 380], ['New York', 356]]
Solution
import requests
BASE_USAJOBS_URL = "https://data.usajobs.gov/api/jobs"
names = ['California', 'Florida', 'Maryland', 'New York']
thelist = []
for name in names:
    atts = {'CountrySubdivision': name, 'NumberOfJobs': 1}
    resp = requests.get(BASE_USAJOBS_URL, params = atts)
    jobcount = resp.json()['TotalJobs']
    thelist.append([name, jobcount])

print(thelist)
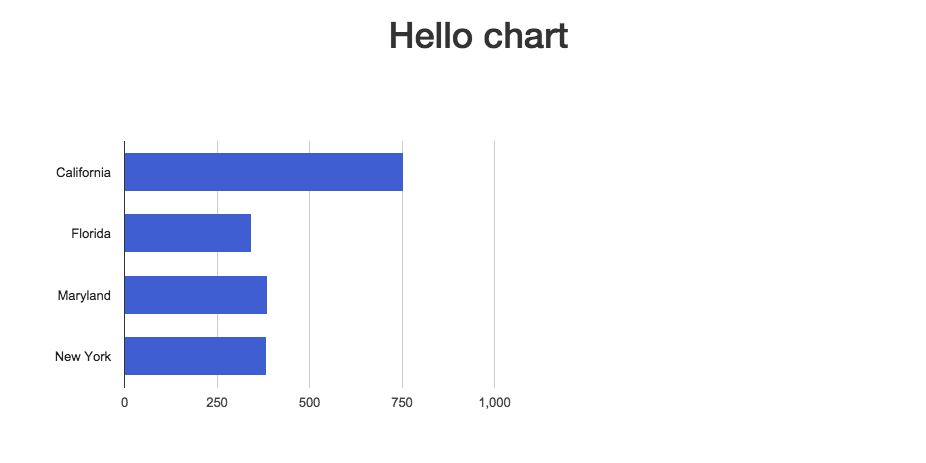
6. Create an interactive Google Bar Chart showing the job counts
For the same 4 states in Exercise 1-4, produce the HTML needed to display the job count data as an interactive Google Bar Chart.
Takeaway
Learning the front-end stack of web development (e.g. HTML, CSS, JavaScript, the Document Object Model, asynchronous programming) is beyond the scope of this class. However, if you can accept that the code for a webpage itself ends up being just text, then it should seem possible that, if given a working template – even one with an interactive element – you could create your own customized webpage by just replacing the parts specific to your data (and isn't that what most programming consists of?)
Also, take note of how the output format in Exercise 1-5 is directly relevant to making this exercise (as well as 1-7, 1-8, and 1-9) trivially easy.
(Hint: read on to Exercise 1-7 if you have no clue how to start on this)
Copy the HTML from this example file and adapt it as necessary:
http://2015.compjour.org/files/code/answers/usajobs-midterm-1/sample-barchart-1.html
(Note: If you open the sample webpage in your browser, it will render all of the chart code…which is not what you want. Try using requests.get() instead, to get the bare HTML. Or use View Source (but not Inspect Element ) )
Your program must create a HTML file named: 1-6.html
Result
http://2015.compjour.org/files/code/answers/usajobs-midterm-1/1-6.html

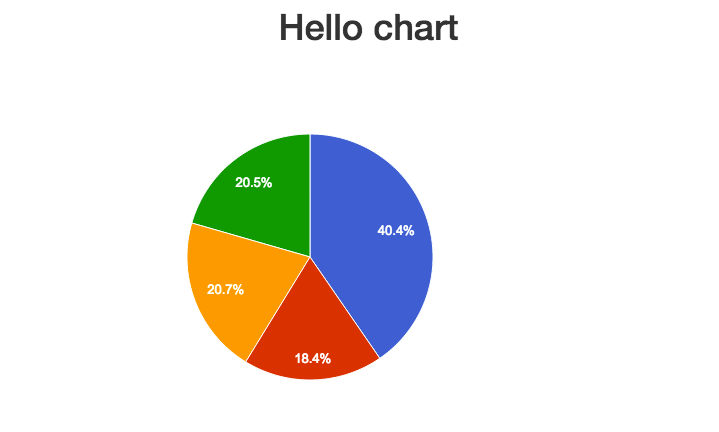
7. * Create an interactive Google Pie Chart for the 4 states
For the same 4 states in Exercise 1-4, produce the HTML needed to display the job count data as an interactive Google Bar Chart.
Takeaway
To belabor the point that, with a working template and the ability to read instructions, you can create a variety of charts and pages to your liking. The code to solve this problem should be virtually identical to Exercise 1-6.
Copy the HTML from this example file and adapt it as necessary:
(Hint: Besides replacing the data element, you also have to do the necessary change to make a pie instead of a bar chart)
http://2015.compjour.org/files/code/answers/usajobs-midterm-1/sample-barchart-1.html
(Note: If you open the sample webpage in your browser, it will render all of the chart code…which is not what you want. Try using requests.get() instead, to get the bare HTML. Or use View Source (but not Inspect Element ) )
Your program must create a HTML file named: 1-7.html
Result
http://2015.compjour.org/files/code/answers/usajobs-midterm-1/1-7.html

Solution
import requests
# same code from problem 5
BASE_USAJOBS_URL = "https://data.usajobs.gov/api/jobs"
names = ['California', 'Florida', 'Maryland', 'New York']
thelist = []
thelist.append(["State", "Job Count"])
for n in names:
    atts = {'CountrySubdivision': n, 'NumberOfJobs': 1}
    resp = requests.get(BASE_USAJOBS_URL, params = atts)
    jobcount = int(resp.json()['TotalJobs'])
    thelist.append([n, jobcount])


# Throw the boilerplate HTML into a variable:

chartcode = """
<!DOCTYPE html>
<html>
  <head>
    <title>Sample Chart</title>
    <script type="text/javascript" src="https://www.google.com/jsapi"></script>
    <link rel="stylesheet" href="https://maxcdn.bootstrapcdn.com/bootstrap/3.3.4/css/bootstrap.min.css">

  </head>
  <body>
    <script type="text/javascript">
      google.load("visualization", '1.1', {packages:['corechart']});
      google.setOnLoadCallback(drawChart);
      function drawChart() {
        var data = %s

        var datatable = google.visualization.arrayToDataTable(data);
        var options = {
          width: 600,
          height: 400,
          legend: { position: 'none' },
        };
        var chart = new google.visualization.PieChart(document.getElementById('mychart'));
        chart.draw(datatable, options);
    }
    </script>

      <div class="container">
        <h1 style="text-align:center">Hello chart</h1>
        <div id="mychart"></div>
      </div>
  </body>
</html>
"""


htmlfile = open("1-7.html", "w")
htmlfile.write(chartcode % thelist)
htmlfile.close()
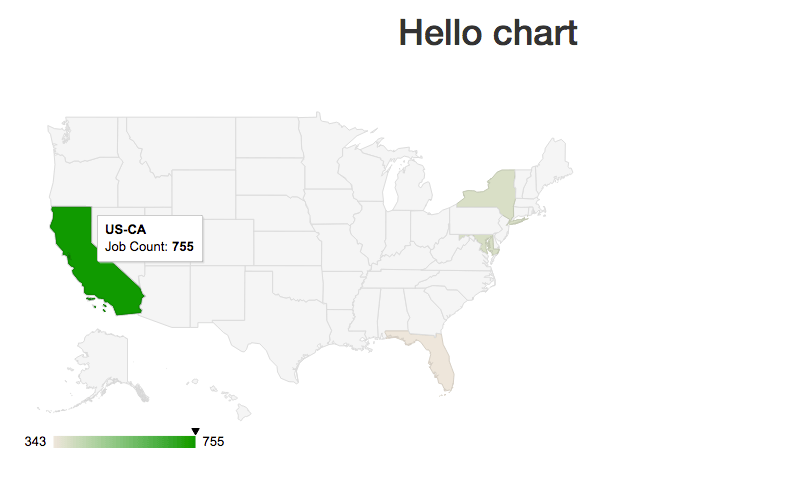
8. Create an interactive Google Geochart for all 4 states
Same setup as exercises 1-6 and 1-7, except create a Geochart visualization.
As per the Google documentation, you must translate state names to their corresponding ISO_3166-2:US codes, e.g. California is US-CA (which all end up being their standard postal abbreviation, prepended by US-)
For your convenience, I've produced this JSON file which contains a dictionary that maps each full state name to its corresponding postal abbreviation:
http://stash.compjour.org/data/usajobs/us-statecodes.json
For the chart, copy the HTML from this example file and adapt it as necessary:
http://2015.compjour.org/files/code/answers/usajobs-midterm-1/sample-geochart-1.html
Your program must create a HTML file named: 1-8.html
Takeaway
Again, observe the wide variety of charts you can make using the same data-gathering/processing code from the previous exercises. A map is not ideal for this kind of data, but since Google makes it so easy, might as well try it out.
Result
http://2015.compjour.org/files/code/answers/usajobs-midterm-1/1-8.html

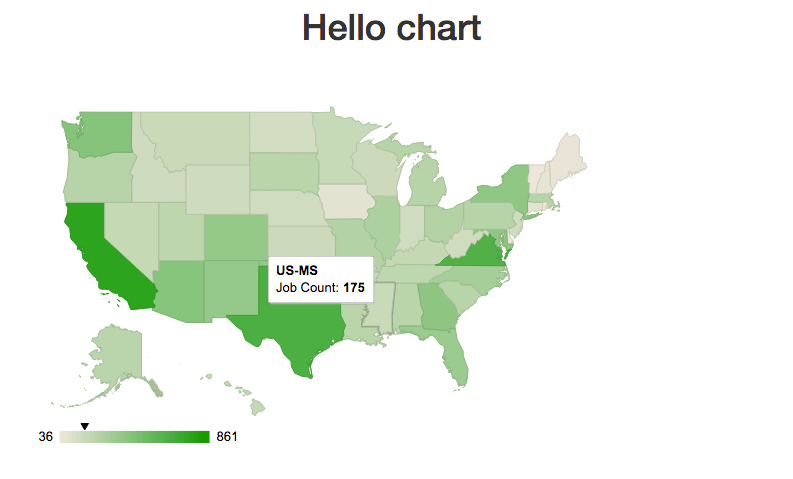
9. Create an interactive Google Geochart for all 50 states
Same setup as Exercise 1-8, except repeat for all 50 states and Washington D.C.. You will re-use virtually all of the code from 1-8, but you need to add code to generate a list of all the states.
(Do not hand-type all 51 names in; doing so misses the point of this exercise and will result in zero-credit for this problem).
For your convenience, I've produced this JSON file which contains a dictionary that maps each full state name to its corresponding postal abbreviation:
http://stash.compjour.org/data/usajobs/us-statecodes.json
Use the same sample chart HTML as per Exercise 1-8:
http://2015.compjour.org/files/code/answers/usajobs-midterm-1/sample-geochart-1.html
Takeaway
This exercise is the exact same pattern/process as Exercise 1-8. The only difference is the amount of data to process: 51 names as opposed to 4. But the only significant increase in our work is to actually get those names in such a way that we feed it into our existing program – everything else, from calling the API to making the map, involves no more sweat from us whether the data has 10 names or 10,000 names.
And in this case, the challenge of getting those 51 names is yet another challenge made relatively easy with an understanding and appreciation of for-loops and data structures. I've given you a machine-readable list of state names as JSON; extracting the names (and their abbreviations) is no different than the process of extracting data from the USAJobs API itself.
Result
http://2015.compjour.org/files/code/answers/usajobs-midterm-1/1-9.html

All Solutions
1-1.
import requests
BASE_USAJOBS_URL = "https://data.usajobs.gov/api/jobs"
state_name = 'New York'
atts = {"CountrySubdivision": state_name, 'NumberOfJobs': 1}
resp = requests.get(BASE_USAJOBS_URL, params = atts)
data = resp.json()
print("%s has %s job listings." % (state_name, data['TotalJobs']))
1-2.
import requests
BASE_USAJOBS_URL = "https://data.usajobs.gov/api/jobs"
atts = {"CountrySubdivision": 'Alaska', 'NumberOfJobs': 1}
ak_resp = requests.get(BASE_USAJOBS_URL, params = atts)
ak_data = ak_resp.json()

atts = {"CountrySubdivision": 'Hawaii', 'NumberOfJobs': 1}
ha_resp = requests.get(BASE_USAJOBS_URL, params = atts)
ha_data = ha_resp.json()

print("Alaska has %s job listings." % ak_data['TotalJobs'])
print("Hawaii has %s job listings." % ha_data['TotalJobs'])
t = int(ak_data['TotalJobs']) + int(ha_data['TotalJobs'])
print("Together, they have %s total job listings." % t)
1-3.
import requests
BASE_USAJOBS_URL = "https://data.usajobs.gov/api/jobs"
countries = ['China', 'South Africa', 'Tajikistan']
total_jobs = 0
for cname in countries:
    atts = {'Country': cname,  'NumberOfJobs': 1}
    resp = requests.get(BASE_USAJOBS_URL, params = atts)
    tjobs = int(resp.json()['TotalJobs'])
    print("%s currently has %s job listings.." % (cname, tjobs))
    total_jobs += tjobs

print("Together, they have %s total job listings." % total_jobs)
1-4.
import requests
BASE_USAJOBS_URL = "https://data.usajobs.gov/api/jobs"
names = ['California', 'Florida', 'Maryland', 'New York']
thedict = {}
for c in names:
    resp = requests.get(BASE_USAJOBS_URL, params = {'CountrySubdivision': c, 'NumberOfJobs': 1})
    thedict[c] = int(resp.json()['TotalJobs'])


print(thedict)
1-5.
import requests
BASE_USAJOBS_URL = "https://data.usajobs.gov/api/jobs"
names = ['California', 'Florida', 'Maryland', 'New York']
thelist = []
for name in names:
    atts = {'CountrySubdivision': name, 'NumberOfJobs': 1}
    resp = requests.get(BASE_USAJOBS_URL, params = atts)
    jobcount = resp.json()['TotalJobs']
    thelist.append([name, jobcount])

print(thelist)
1-6.
import requests
# same code from problem 5
BASE_USAJOBS_URL = "https://data.usajobs.gov/api/jobs"
names = ['California', 'Florida', 'Maryland', 'New York']
thelist = []
thelist.append(["State", "Job Count"])
for n in names:
    atts = {'CountrySubdivision': n, 'NumberOfJobs': 1}
    resp = requests.get(BASE_USAJOBS_URL, params = atts)
    jobcount = int(resp.json()['TotalJobs'])
    thelist.append([n, jobcount])


# Throw the boilerplate HTML into a variable:

chartcode = """
<!DOCTYPE html>
<html>
  <head>
    <title>Sample Chart</title>
    <script type="text/javascript" src="https://www.google.com/jsapi"></script>
    <link rel="stylesheet" href="https://maxcdn.bootstrapcdn.com/bootstrap/3.3.4/css/bootstrap.min.css">

  </head>
  <body>
    <script type="text/javascript">
      google.load("visualization", '1.1', {packages:['corechart']});
      google.setOnLoadCallback(drawChart);
      function drawChart() {
        var data = %s

        var datatable = google.visualization.arrayToDataTable(data);
        var options = {
          width: 600,
          height: 400,
          legend: { position: 'none' },
        };
        var chart = new google.visualization.BarChart(document.getElementById('mychart'));
        chart.draw(datatable, options);
    }
    </script>

      <div class="container">
        <h1 style="text-align:center">Hello chart</h1>
        <div id="mychart"></div>
      </div>
  </body>
</html>
"""


htmlfile = open("1-6.html", "w")
htmlfile.write(chartcode % thelist)
htmlfile.close()
1-7.
import requests
# same code from problem 5
BASE_USAJOBS_URL = "https://data.usajobs.gov/api/jobs"
names = ['California', 'Florida', 'Maryland', 'New York']
thelist = []
thelist.append(["State", "Job Count"])
for n in names:
    atts = {'CountrySubdivision': n, 'NumberOfJobs': 1}
    resp = requests.get(BASE_USAJOBS_URL, params = atts)
    jobcount = int(resp.json()['TotalJobs'])
    thelist.append([n, jobcount])


# Throw the boilerplate HTML into a variable:

chartcode = """
<!DOCTYPE html>
<html>
  <head>
    <title>Sample Chart</title>
    <script type="text/javascript" src="https://www.google.com/jsapi"></script>
    <link rel="stylesheet" href="https://maxcdn.bootstrapcdn.com/bootstrap/3.3.4/css/bootstrap.min.css">

  </head>
  <body>
    <script type="text/javascript">
      google.load("visualization", '1.1', {packages:['corechart']});
      google.setOnLoadCallback(drawChart);
      function drawChart() {
        var data = %s

        var datatable = google.visualization.arrayToDataTable(data);
        var options = {
          width: 600,
          height: 400,
          legend: { position: 'none' },
        };
        var chart = new google.visualization.PieChart(document.getElementById('mychart'));
        chart.draw(datatable, options);
    }
    </script>

      <div class="container">
        <h1 style="text-align:center">Hello chart</h1>
        <div id="mychart"></div>
      </div>
  </body>
</html>
"""


htmlfile = open("1-7.html", "w")
htmlfile.write(chartcode % thelist)
htmlfile.close()
1-8.
# nothing here yet
1-9.
import requests
BASE_USAJOBS_URL = "https://data.usajobs.gov/api/jobs"
STATECODES_URL = "http://stash.compjour.org/data/usajobs/us-statecodes.json"
names = requests.get(STATECODES_URL).json()
## Everything from 1-8 on is the same:
thelist = []
thelist.append(["State", "Job Count"])
for name, abbrev in names.items():
    print("Getting: ", name)
    atts = {'CountrySubdivision': name, 'NumberOfJobs': 1}
    resp = requests.get(BASE_USAJOBS_URL, params = atts)
    jobcount = int(resp.json()['TotalJobs'])
    label = "US-" + abbrev
    thelist.append([label, jobcount])


chartcode = """
<html>
  <head>
    <link rel="stylesheet" href="https://maxcdn.bootstrapcdn.com/bootstrap/3.3.4/css/bootstrap.min.css">
    <script type="text/javascript" src="https://www.google.com/jsapi"></script>
  </head>
  <body>
    <script type="text/javascript">
      google.load("visualization", "1", {packages:["geochart"]});
      google.setOnLoadCallback(drawRegionsMap);

      function drawRegionsMap() {

        var data = %s
        var datatable = google.visualization.arrayToDataTable(data);
        var options = {'region': 'US', 'width': 600, 'height': 400, 'resolution': 'provinces'};

        var chart = new google.visualization.GeoChart(document.getElementById('mychart'));

        chart.draw(datatable, options);
      }
    </script>


      <div class="container">
        <h1 style="text-align:center">Hello chart</h1>
        <div id="mychart"></div>
      </div>
  </body>
</html>
"""


htmlfile = open("1-9.html", "w")
htmlfile.write(chartcode % thelist)
htmlfile.close()